Fact A: the best deal you can make is when you buy under the market price
Fact B: the more middlemen there are between you and the source, the more margin is added to the final diamond price, the so called retail price. It is usually far above the real diamond price list.
Wholesale loose diamonds come directly from the diamond source and have not passed through middlemen, marketing cost or have price adds due to other overhead cost such as retail cost. It's actually THE ONLY PROVEN WAY TO SAVE ON DIAMONDS.

| i.f. | vvs1 | vvs2 | vs1 | vs2 | si1 | si2 | |
|---|---|---|---|---|---|---|---|
| D | 21633 | 18488 | 15820 | 14104 | 12580 | 10007 | 8005 |
| E | 18525 | 16910 | 14440 | 13205 | 11685 | 9595 | 7695 |
| F | 16031 | 14711 | 12636 | 11882 | 10656 | 9053 | 7261 |
| G | 13191 | 12337 | 11008 | 10344 | 9775 | 8636 | 7023 |
| H | 10651 | 10176 | 9415 | 8939 | 8559 | 8084 | 6752 |
| I | 8618 | 8239 | 7765 | 7481 | 7197 | 6913 | 6156 |
| J | 7185 | 6898 | 6610 | 6419 | 6131 | 5844 | 5461 |
| K | 6112 | 5826 | 5539 | 5348 | 5062 | 4680 | 4393 |
| i.f. | vvs1 | vvs2 | vs1 | vs2 | si1 | si2 | |
|---|---|---|---|---|---|---|---|
| D | 34785 | 29067 | 24302 | 20966 | 17631 | 14295 | 11436 |
| E | 27550 | 24700 | 21850 | 19000 | 16150 | 13300 | 10450 |
| F | 24047 | 22161 | 19803 | 16974 | 15088 | 12259 | 9713 |
| G | 19929 | 18031 | 16133 | 14710 | 13286 | 11388 | 9300 |
| H | 16167 | 15216 | 14265 | 12839 | 11412 | 10461 | 8939 |
| I | 11838 | 11364 | 10891 | 10417 | 9944 | 8997 | 8050 |
| J | 10059 | 9580 | 9101 | 8622 | 8143 | 7664 | 7185 |
| K | 9073 | 8118 | 7354 | 6876 | 6399 | 5921 | 5539 |
| i.f. | vvs1 | vvs2 | vs1 | vs2 | si1 | si2 | |
|---|---|---|---|---|---|---|---|
| D | 55274 | 47650 | 39073 | 34308 | 28590 | 20966 | 16678 |
| E | 43700 | 39900 | 34675 | 29925 | 25650 | 19000 | 15675 |
| F | 38192 | 34891 | 30648 | 26876 | 22632 | 17446 | 14617 |
| G | 31317 | 29419 | 26572 | 23725 | 20404 | 16133 | 13286 |
| H | 23775 | 22349 | 20922 | 19496 | 16643 | 14265 | 11888 |
| I | 18940 | 17520 | 16573 | 15626 | 13732 | 12311 | 10417 |
| J | 14849 | 13891 | 13412 | 12454 | 11496 | 10538 | 9580 |
| K | 12415 | 11460 | 10983 | 10028 | 9550 | 8786 | 8118 |
| i.f. | vvs1 | vvs2 | vs1 | vs2 | si1 | si2 | |
|---|---|---|---|---|---|---|---|
| D | 72905 | 59563 | 52892 | 45744 | 37167 | 26684 | 19060 |
| E | 57000 | 51300 | 46075 | 41325 | 34675 | 24700 | 18050 |
| F | 50451 | 45264 | 41021 | 36306 | 31119 | 22632 | 16974 |
| G | 39858 | 37011 | 34639 | 31792 | 26572 | 19929 | 15659 |
| H | 30908 | 29481 | 27579 | 25677 | 22349 | 16643 | 14741 |
| I | 23675 | 22255 | 20834 | 19887 | 17046 | 14205 | 12311 |
| J | 18681 | 17723 | 16286 | 15328 | 13891 | 12454 | 11017 |
| K | 15758 | 14803 | 13848 | 12893 | 11938 | 10505 | 9550 |
| i.f. | vvs1 | vvs2 | vs1 | vs2 | si1 | si2 | |
|---|---|---|---|---|---|---|---|
| D | 102924 | 80529 | 70522 | 63851 | 52415 | 35261 | 26208 |
| E | 75050 | 68400 | 61750 | 57000 | 47025 | 32775 | 24225 |
| F | 65067 | 60352 | 54694 | 50451 | 41021 | 29705 | 22632 |
| G | 53619 | 49823 | 45552 | 42231 | 35588 | 26572 | 21353 |
| H | 42320 | 38991 | 36138 | 33285 | 28530 | 21873 | 18545 |
| I | 32672 | 30304 | 28410 | 26516 | 22255 | 18467 | 15626 |
| J | 24908 | 22992 | 21555 | 20597 | 19160 | 16286 | 13891 |
| K | 19100 | 17668 | 16713 | 15758 | 14803 | 13370 | 11938 |
| i.f. | vvs1 | vvs2 | vs1 | vs2 | si1 | si2 | |
|---|---|---|---|---|---|---|---|
| D | 113175 | 87012 | 76612 | 69319 | 58833 | 35686 | 25434 |
| E | 83406 | 76931 | 68297 | 62795 | 53283 | 32971 | 24059 |
| F | 75059 | 70892 | 65110 | 57575 | 44549 | 29752 | 22329 |
| G | 58572 | 54702 | 50319 | 43535 | 37408 | 28746 | 20856 |
| H | 45205 | 42374 | 39317 | 36210 | 29384 | 22749 | 18717 |
| I | 33932 | 31831 | 31175 | 29470 | 24693 | 19208 | 15608 |
| J | 26336 | 24806 | 23151 | 21539 | 20720 | 17169 | 14578 |
| K | 20977 | 19873 | 18457 | 16889 | 15959 | 13560 | 11593 |
| i.f. | vvs1 | vvs2 | vs1 | vs2 | si1 | si2 | |
|---|---|---|---|---|---|---|---|
| D | 122232 | 93975 | 82743 | 74866 | 63541 | 38542 | 27469 |
| E | 90081 | 83088 | 73763 | 67821 | 57548 | 35610 | 25981 |
| F | 81066 | 76566 | 70321 | 62182 | 48114 | 32133 | 24116 |
| G | 63260 | 59080 | 54346 | 47020 | 40402 | 31046 | 22525 |
| H | 48823 | 45765 | 42464 | 39108 | 31735 | 24569 | 20215 |
| I | 36648 | 34379 | 33670 | 31828 | 26669 | 20745 | 16857 |
| J | 28444 | 26791 | 25004 | 23263 | 22378 | 18543 | 15745 |
| K | 22656 | 21463 | 19934 | 18240 | 17236 | 14645 |
12521
|
| i.f. | vvs1 | vvs2 | vs1 | vs2 | si1 | si2 | |
|---|---|---|---|---|---|---|---|
| D | 132014 | 101496 | 89365 | 80858 | 68626 | 41626 | 29668 |
| E | 97290 | 89737 | 79666 | 73248 | 62153 | 38459 | 28060 |
| F | 87553 | 82694 | 75949 | 67159 | 51965 | 34705 | 26046 |
| G | 68323 | 63808 | 58696 | 50783 | 43635 | 33531 | 24328 |
| H | 52731 | 49427 | 45862 | 42238 | 34275 | 26536 | 21833 |
| I | 39581 | 37130 | 36364 | 34376 | 28804 | 22405 | 18206 |
| J | 30720 | 28935 | 27005 | 25125 | 24169 | 20027 | 17005 |
| K | 24469 | 23181 | 21530 | 19700 | 18616 | 15817 | 13523 |
| i.f. | vvs1 | vvs2 | vs1 | vs2 | si1 | si2 | |
|---|---|---|---|---|---|---|---|
| D | 142579 | 109619 | 96517 | 87329 | 74118 | 44958 | 32042 |
| E | 105077 | 96919 | 86042 | 79110 | 67127 | 41537 | 30306 |
| F | 94560 | 89312 | 82027 | 72533 | 56124 | 37482 | 28130 |
| G | 73791 | 68914 | 63393 | 54847 | 47127 | 36215 | 26275 |
| H | 56951 | 53383 | 49532 | 45618 | 37018 | 28659 | 23580 |
| I | 42749 | 40101 | 39275 | 37127 | 31109 | 24199 | 19663 |
| J | 33179 | 31251 | 29166 | 27136 | 26103 | 21630 | 18366 |
| K | 26427 | 25036 | 23253 | 21277 | 20105 | 17083 | 14605 |
| i.f. | vvs1 | vvs2 | vs1 | vs2 | si1 | si2 | |
|---|---|---|---|---|---|---|---|
| D | 159628 | 119125 | 104830 | 95777 | 84341 | 52892 | 37644 |
| E | 114475 | 105450 | 95475 | 86450 | 74100 | 48925 | 35625 |
| F | 99958 | 94300 | 84870 | 75912 | 63181 | 44793 | 33005 |
| G | 83987 | 79716 | 72599 | 63583 | 55042 | 40333 | 30843 |
| H | 66570 | 62291 | 57536 | 52781 | 43746 | 33761 | 27579 |
| I | 49244 | 46403 | 44509 | 42142 | 35513 | 28884 | 23202 |
| J | 37841 | 35925 | 34009 | 32572 | 30177 | 24908 | 21076 |
| K | 29128 | 27695 | 26263 | 24830 | 22920 | 19578 | 16713 |
| i.f. | vvs1 | vvs2 | vs1 | vs2 | si1 | si2 | |
|---|---|---|---|---|---|---|---|
| D | 14772 | 13247 | 11817 | 10769 | 9721 | 8386 | 6862 |
| E | 13205 | 12065 | 10640 | 9975 | 9215 | 7980 | 6555 |
| F | 9680 | 9300 | 8921 | 8541 | 7972 | 7307 | 6074 |
| G | 8179 | 7798 | 7513 | 7323 | 7037 | 6752 | 5801 |
| H | 8179 | 7798 | 7513 | 7323 | 7037 | 6752 | 5801 |
| I | 6818 | 6534 | 6250 | 6061 | 5871 | 5682 | 5209 |
| J | 5365 | 5173 | 4982 | 4790 | 4694 | 4503 | 4311 |
| K | 4489 | 4298 | 4107 | 3916 | 3820 | 3629 | 3438 |
| i.f. | vvs1 | vvs2 | vs1 | vs2 | si1 | si2 | |
|---|---|---|---|---|---|---|---|
| D | 21919 | 19537 | 17631 | 15725 | 14295 | 11913 | 9054 |
| E | 18525 | 16625 | 15675 | 14250 | 13300 | 11115 | 8550 |
| F | 16503 | 15088 | 14145 | 13202 | 12259 | 10373 | 8110 |
| G | 14710 | 13761 | 12812 | 12337 | 11388 | 9490 | 7782 |
| H | 11792 | 10651 | 10081 | 9605 | 9130 | 8654 | 7323 |
| I | 8902 | 8239 | 7860 | 7576 | 7387 | 7103 | 6818 |
| J | 7185 | 6898 | 6706 | 6514 | 6323 | 6131 | 5844 |
| K | 6112 | 5826 | 5635 | 5444 | 5348 | 5157 | 4871 |
| i.f. | vvs1 | vvs2 | vs1 | vs2 | si1 | si2 | |
|---|---|---|---|---|---|---|---|
| D | 41456 | 31926 | 28114 | 25255 | 22396 | 18584 | 11436 |
| E | 31350 | 28025 | 25175 | 22800 | 20425 | 17100 | 10450 |
| F | 27819 | 24990 | 22632 | 20746 | 18389 | 15560 | 9713 |
| G | 24200 | 22302 | 20878 | 18980 | 16608 | 14235 | 9300 |
| H | 19971 | 18545 | 17118 | 16167 | 13790 | 12363 | 8939 |
| I | 15626 | 14679 | 13732 | 12785 | 11364 | 10417 | 8050 |
| J | 11975 | 11017 | 10538 | 10059 | 9101 | 8622 | 7185 |
| K | 9741 | 8977 | 8500 | 7927 | 7449 | 6972 | 5539 |
| i.f. | vvs1 | vvs2 | vs1 | vs2 | si1 | si2 | |
|---|---|---|---|---|---|---|---|
| D | 49556 | 40026 | 37644 | 35261 | 31926 | 20966 | 14772 |
| E | 39900 | 36575 | 34675 | 32300 | 29450 | 19475 | 13775 |
| F | 36306 | 33948 | 32062 | 29705 | 25933 | 17917 | 12731 |
| G | 32266 | 29419 | 27521 | 25623 | 21827 | 16608 | 12337 |
| H | 26628 | 24726 | 22824 | 21398 | 18545 | 14741 | 11412 |
| I | 19414 | 17993 | 17046 | 16099 | 14679 | 12785 | 10417 |
| J | 15807 | 14849 | 13891 | 12933 | 11975 | 11017 | 9580 |
| K | 12893 | 11938 | 10983 | 10505 | 9550 | 9073 | 8118 |
| i.f. | vvs1 | vvs2 | vs1 | vs2 | si1 | si2 | |
|---|---|---|---|---|---|---|---|
| D | 76240 | 57657 | 53368 | 50509 | 41932 | 29067 | 20013 |
| E | 56525 | 52250 | 49400 | 47025 | 38950 | 27075 | 19000 |
| F | 50451 | 47622 | 45264 | 42907 | 35363 | 24990 | 17917 |
| G | 42231 | 39858 | 37011 | 34639 | 29419 | 22776 | 17082 |
| H | 35187 | 32810 | 30432 | 28055 | 24726 | 19496 | 15692 |
| I | 26990 | 25096 | 22728 | 20834 | 18940 | 16573 | 13732 |
| J | 19639 | 18202 | 17244 | 15807 | 14849 | 13891 | 12454 |
| K | 15756 | 14803 | 13848 | 12893 | 12415 | 11460 | 10505 |
| i.f. | vvs1 | vvs2 | vs1 | vs2 | si1 | si2 | |
|---|---|---|---|---|---|---|---|
| D | 91169 | 62791 | 58516 | 55752 | 47994 | 30710 | 20221 |
| E | 61248 | 57585 | 53810 | 49743 | 43452 | 29054 | 19108 |
| F | 56798 | 54822 | 50647 | 47140 | 38624 | 26291 | 17379 |
| G | 47283 | 43661 | 40728 | 37202 | 30920 | 23497 | 16359 |
| H | 40423 | 37159 | 33974 | 31529 | 26833 | 20780 | 14482 |
| I | 27318 | 25693 | 24087 | 20596 | 19165 | 15720 | 12051 |
| J | 20092 | 18188 | 17541 | 14922 | 13965 | 12974 | 11109 |
| K | 16024 | 14817 | 14057 | 12281 | 12562 | 10505 | 9399 |
| i.f. | vvs1 | vvs2 | vs1 | vs2 | si1 | si2 | |
|---|---|---|---|---|---|---|---|
| D | 100285 | 69070 | 64367 | 60214 | 51835 | 33781 | 22243 |
| E | 67372 | 63343 | 58116 | 53724 | 46930 | 31379 | 21019 |
| F | 62477 | 60304 | 54700 | 50912 | 41715 | 28396 | 19117 |
| G | 52010 | 48027 | 43987 | 40179 | 34012 | 25377 | 17995 |
| H | 43658 | 40132 | 36693 | 34052 | 28981 | 22443 | 15930 |
| I | 29504 | 27749 | 26015 | 22244 | 21082 | 17292 | 13256 |
| J | 22101 | 19643 | 18945 | 16114 | 15361 | 14271 | 12220 |
| K | 17626 | 16001 | 15182 | 13264 | 13818 | 11556 | 10339 |
| i.f. | vvs1 | vvs2 | vs1 | vs2 | si1 | si2 | |
|---|---|---|---|---|---|---|---|
| D | 110313 | 75976 | 70803 | 65033 | 55983 | 37158 | 24467 |
| E | 74109 | 69677 | 62767 | 58023 | 50686 | 33891 | 23121 |
| F | 68724 | 66334 | 59078 | 54987 | 45054 | 30668 | 21028 |
| G | 57211 | 52829 | 47508 | 43395 | 37413 | 27408 | 19794 |
| H | 47152 | 43344 | 39629 | 36778 | 31300 | 24239 | 17522 |
| I | 31866 | 29970 | 28097 | 24024 | 23190 | 19021 | 14582 |
| J | 24311 | 21216 | 20461 | 17404 | 16897 | 15698 | 13442 |
| K | 19388 | 17280 | 16397 | 14325 | 15199 | 12711 | 11373 |
| i.f. | vvs1 | vvs2 | vs1 | vs2 | si1 | si2 | |
|---|---|---|---|---|---|---|---|
| D | 121343 | 83573 | 77883 | 70237 | 60463 | 40874 | 26913 |
| E | 81519 | 76644 | 67790 | 62667 | 54742 | 36603 | 25433 |
| F | 75596 | 72966 | 63806 | 59387 | 48659 | 33122 | 23131 |
| G | 62931 | 58111 | 51310 | 46867 | 41154 | 29602 | 21773 |
| H | 50962 | 46813 | 42801 | 39721 | 33805 | 26177 | 19274 |
| I | 34416 | 32368 | 30346 | 25947 | 25508 | 20923 | 16040 |
| J | 26742 | 22913 | 22098 | 18797 | 18587 | 17268 | 14786 |
| K | 21327 | 18663 | 17709 | 15472 | 16719 | 13982 | 12510 |
| i.f. | vvs1 | vvs2 | vs1 | vs2 | si1 | si2 | |
|---|---|---|---|---|---|---|---|
| D | 136279 | 98159 | 89582 | 83388 | 70046 | 46697 | 32402 |
| E | 97850 | 88350 | 81225 | 75050 | 64600 | 43225 | 30400 |
| F | 85342 | 79684 | 74969 | 66953 | 57052 | 39606 | 27819 |
| G | 69277 | 64532 | 60736 | 57415 | 48399 | 36537 | 26098 |
| H | 56585 | 52305 | 49452 | 46599 | 38991 | 31383 | 23775 |
| I | 42615 | 39774 | 37880 | 33619 | 30778 | 25569 | 20361 |
| J | 32572 | 30177 | 28740 | 25866 | 23471 | 21076 | 17723 |
| K | 25785 | 23875 | 22443 | 21010 | 19578 | 17190 | 15280 |
To get the answer on the question, ‘How to calculate diamond prices?’ from our diamond experts, check the Diamond Price Chart. This table provides information on diamond prices for loose wholesale diamonds. You can consider this as a proper start in getting acquainted with the industry rules.
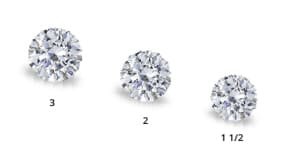
Just select the desired color and clarity of a diamond in an engagement ring that is on your mind. The chart will show you the wholesale diamond prices. Here you’ll see the example of diamond price chart for 3 carat diamonds.
Wholesale Price To The Public Since 1961
The Diamond Concierge Helping You to Estimate the Perfect Diamond at Wholesale Price. Always ask us first!
Now you can read all the necessary information and reach experts online, which neglects the uncertainty risks completely. And these days, the basic principle of buying a great diamond became simple: to know your own mind and to make certain you’ll get what you asked.
But even if you’re clear with your desires and found a reliable diamond partner, the price may still remain an open question. So, here the question of how to get the best diamond possible and read the price list correctly.
Learn the exact aspects of your diamond!.
Ensure your seller will get the most valuable, radiant, and massive diamond for your budget!
As you may see, getting a diamond price list no longer requires any superpowers or detective skills. The ability to read the diamond prices from the chart correctly is what customers ask today.
So, to know the fundamental rule of how professionals calculate diamond prices, meet the term “price per carat.” In a chart, it serves as an entry point in the diamond industry pricing list for an inexperienced buyer.
The formula itself is really simple:
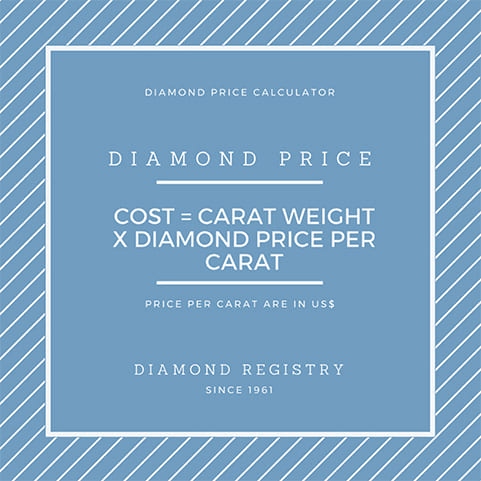
Let’s say, you have chosen a diamond in a category estimated $2,000 per carat. In this case, the gemstone of 2.5 carat will cost you $2,000 * 2.50, or $5,000.
The same principle applies to the diamond with certain stable parameters. For example, you have chosen a diamond ring of VVS1 clarity, oval cutting, and D color. This weight category is estimated in $31,000, so the pricing for a 2 carat jewel is $31,0000 * 2, or $61,000.
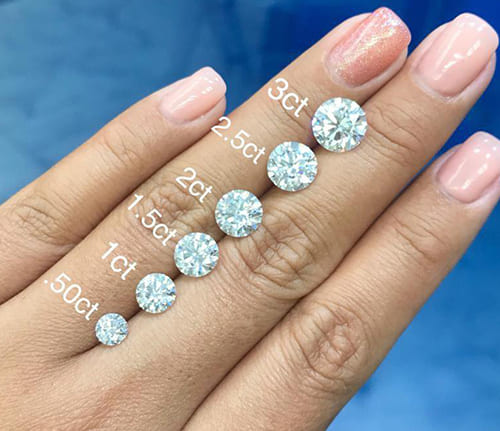
As a takeaway message, pay attention to the carat number while buying or selling an engagement ring. Weight is more important than color, cut, and clarity parameters. This rule doesn’t apply to big diamonds, though.
Free Wholesale Quote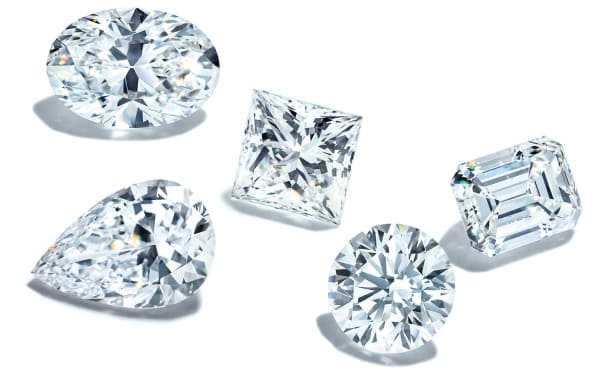
The heavier weight category is, the greater price per carat it receives. That’s what affects the diamond pricing - just as the price per carat. It can be tricky. that affects the diamond pricing is the exactweight category it falls in. It can betricky because the line of 0.01 carat between two categories may result in 20% price difference! The line of 0.01 carat between two categories may result in 20% price difference – even if color, cut, clarity, and the ring design are completely the same! That’s why one of the life hacks in buying the best diamond for less is to choose a 0.9 carat diamond instead of a full one carat gemstone. Just because they refer to different weight categories, their exact weight becomes so dramatically different.
The influential factors are not limited to a carat-related matter only. What is also crucial is cutting. In retail sales, all the manipulation happens with diamond cuts. For the sake of maintaining the perk of higher weight category, the well-known brands tend to avoid making a perfect cutting. In other words, they present not-that-perfectly cut jewels as flawless. Even with a 10% discount, they sell these diamonds 10% higher (because of an initial 20% markup). In the given circumstances, the only way to secure your purchase is to learn everything about cut in advance!
And of course, don’t neglect the role of rarity in your diamond. The more uniqueness a chosen gemstone has, the higher price you pay for it. For example, a completely colorless and ideally cut diamond (being “clean” from all the sides, in simple words) is so expensive simply because it’s truly rare to find. Big diamonds are also rarer than small ones – and the pricing result is the same. So, if you aim at buying D color, flawless clarity, an ideal cut, and enormous diamond weight get ready to pay a fortune for your ring! It will be truly unique.
THere’s the table that demonstrates to you the exact differences between a 2 carat diamond price list and a 3 carat diamond price list.
| 2 carat diamond | i.f. $ | vvs1 $ | vvs2 $ | vs1 $ | vs2 $ | si1 $ | si2 $ |
|---|---|---|---|---|---|---|---|
| D | 34785 | 29067 | 24302 | 20966 | 17631 | 14295 | 11436 |
| E | 27550 | 24700 | 21850 | 19000 | 16150 | 13300 | 10450 |
| F | 24047 | 22161 | 19803 | 16974 | 15088 | 12259 | 9713 |
| G | 19929 | 18031 | 16133 | 14710 | 13286 | 11388 | 9300 |
| H | 16167 | 15216 | 14265 | 12839 | 11412 | 10461 | 8939 |
| I | 11838 | 11364 | 10891 | 10417 | 9944 | 8997 | 8050 |
| J | 10059 | 9580 | 9101 | 8622 | 8143 | 7664 | 7185 |
| K | 9073 | 8118 | 7354 | 6876 | 6399 | 5921 | 5539 |
| 2 carat diamond | i.f. | vvs1 | vvs2 | vs1 | vs2 | si1 | si2 |
|---|---|---|---|---|---|---|---|
| D | 21919 | 19537 | 17631 | 15725 | 14295 | 11913 | 9054 |
| E | 18525 | 16625 | 15675 | 14250 | 13300 | 11115 | 8550 |
| F | 16503 | 15088 | 14145 | 13202 | 12259 | 10373 | 8110 |
| G | 14710 | 13761 | 12812 | 12337 | 11388 | 9490 | 7782 |
| H | 11792 | 10651 | 10081 | 9605 | 9130 | 8654 | 7323 |
| I | 8902 | 8239 | 7860 | 7576 | 7387 | 7103 | 6818 |
| J | 7185 | 6898 | 6706 | 6514 | 6323 | 6131 | 5844 |
| K | 6112 | 5826 | 5635 | 5444 | 5348 | 5157 | 4871 |
| 3 carat diamond | i.f. | vvs1 | vvs2 | vs1 | vs2 | si1 | si2 |
|---|---|---|---|---|---|---|---|
| D | 55274 | 47650 | 39073 | 34308 | 28590 | 20966 | 16678 |
| E | 43700 | 39900 | 34675 | 29925 | 25650 | 19000 | 15675 |
| F | 38192 | 34891 | 30648 | 26876 | 22632 | 17446 | 14617 |
| G | 31317 | 29419 | 26572 | 23725 | 20404 | 16133 | 13286 |
| H | 23775 | 22349 | 20922 | 19496 | 16643 | 14265 | 11888 |
| I | 18940 | 17520 | 16573 | 15626 | 13732 | 12311 | 10417 |
| J | 14849 | 13891 | 13412 | 12454 | 11496 | 10538 | 9580 |
| K | 12415 | 11460 | 10983 | 10028 | 9550 | 8786 | 8118 |
Even though there are many parameters to consider in diamond prices, the pricing models themselves are rather standardized. This means that any observer acquainted with the basic dimensions of a diamond (color, weight, cut, and clarity) can provide the approximate price for any gemstone to buy or sell. However, don’t take this task that easy – the exact value of a jewel only an expert knowing all the market conditions can provide..
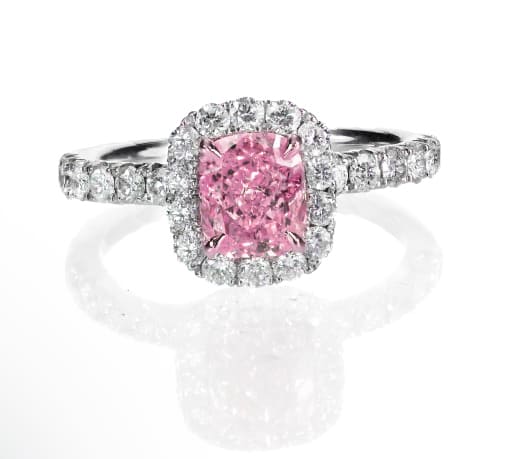
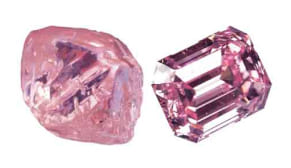
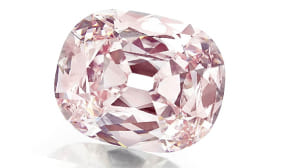
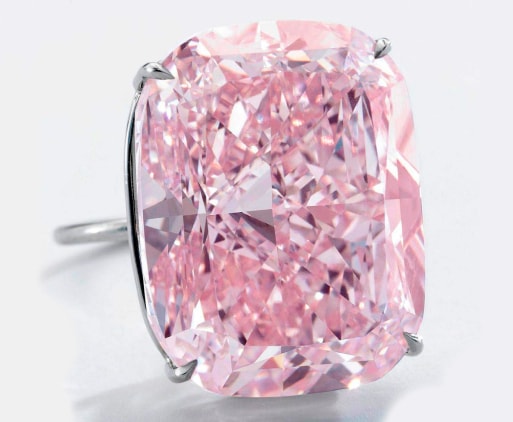
At least, the professionals always stay tuned for more news in the diamond industry. They can track all the differences in the diamond price chart. An increased demand in diamonds of a specific clarity can make the whole diamond weight category more expensive to sell. The same applies to a particular color or cut. In 2015, only experts could predict the rising popularity of princess and cushion gemstones. These days, you need to track trends to see the rising popularity of pink color. Probably, only the top clarity is never-fading classics in the diamond world.
Free Wholesale Quote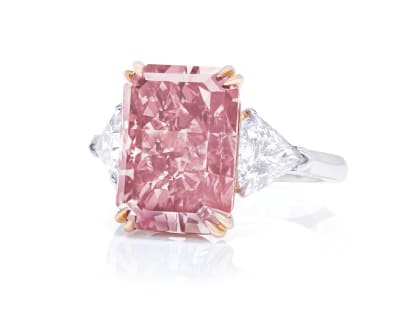
Carat is the source of the core misunderstanding that leads inexperienced buyers into error. The growing carat number doesn’t automatically mean the proportional increase in the size of a jewel! In other words, a 2 carat diamond doesn’t automatically mean the gemstone is twice bigger than a 1 carat diamond. Even if it appears so, the big doesn’t equal the heavy.
At the same time, you already know that the carat size became the pricing standard. The price per carat is taken as a unit for determining the value of a diamond. However, it’s not a sole element in diamond pricing – in reality, the difference range for a 2 carat diamond may get at $65,000! So, be careful and don’t rely on size and weight that much by choosing the engagement ring of your dreams.
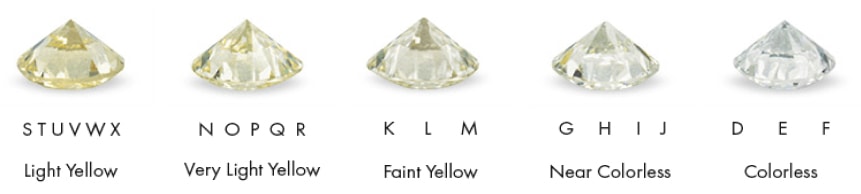
The color grades slightly affect the diamond price list. However, that doesn’t mean you should eliminate the color factor while buying a diamond at all.
The choice of a completely colorless gemstone increases its cost dramatically. But the color hue grades don’t affect the amount of dollars paid for a gemstone. If you want to buy a diamond in a solitaire setting, aim at avoiding “I+” color hue – especially when it comes to round and cushion shapes.
Just keep in mind you can take a slight price off for allowing the higher amount of yellowish tint in a diamond. An H color diamond can be 10% cheaper than a D color one. However, don’t go easy on color decrease – or you’ll lose the crucial points in terms of quality.
The color grades slightly affect the diamond price list. However, that doesn’t mean you should eliminate the color factor while buying a diamond at all.
The choice of a completely colorless gemstone increases its cost dramatically. But the color hue grades don’t affect the amount of dollars paid for a gemstone. If you want to buy a diamond in a solitaire setting, aim at avoiding “I+” color hue – especially when it comes to round and cushion shapes. Just keep in mind you can take a slight price off for allowing the higher amount of yellowish tint in a diamond. An H color diamond can be 10% cheaper than a D color one. However, don’t go easy on color decrease – or you’ll lose the crucial points in terms of quality.
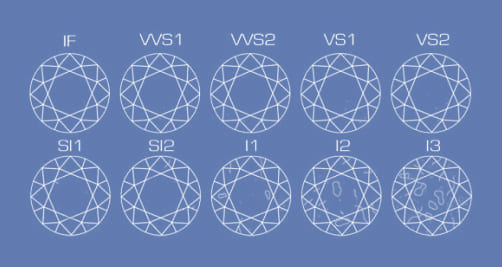
In terms of pricing, a good cut is what brings a diamond its brilliance and sparkle.
In exact terms, the market distinguishes symmetry and polish quality, along with poor, good, and excellent cut grades. Alongside this, take into account the table size and depth. In addition, fluorescence is reflected as a blueish glow under UV light – and being strong enough, it reduces the price without visible flaws.
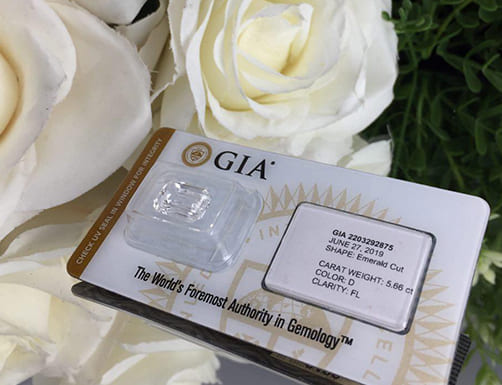
Frequently referred to as a fifth C, GIA certificate is an important factor to take into consideration. It includes the set of diamond features that demonstrate the quality –4Cs, fluorescence, symmetry,image of measurements, diagram of inclusions and blemishesand other important factors. Giving a diamond a report number, the certificate provides a hard copy to secure your purchase. It can also be found in a digital database ifyou need to get your certificate online.
Among various certificates, the ones given by GIA and AGS laboratories are the most respectable in the diamond industry. And their presence is crucial – especially when it comes to a diamond purchase over $1,000.
To make the decent choice, consider the secret ingredient – and probably, the most important factor in finding YOUR diamond. That’s a story a gemstone tells.
And typically, that’s a long and complicated story.
First, the diamond is mined in a special place. For many years, most of the diamonds in the industry were delivered from the poor neighborhoods in Africa. In these regions, armed people herd thousands of innocent villagers into mines – and in the case of non-obedience, they killed them. That poured much blood on diamonds, quickly turning these innocent jewels into the symbol of human cruelty.
In the given circumstances, many people started requesting diamond engagement rings that are free of such histories. Even if they are more expensive in the diamond price chart. Some people even think of rejecting diamonds at all.

To find the exact price per carat, people surf the Internet, searching for relevant diamond price lists. Luckily, you’re on a webpage of the world’s most extensive diamond information platform. So, here’s the place for you to find all the information needed.

The Diamond Registry is the number one source to find loose diamonds at wholesale prices online. Back in 1961, we started as a newsletter bulletin that published diamond price charts for the gemstones of all sizes below 10 carat. From 1996, we do it on the regular basis online. Since then, we have grown into a fully-fledged diamond education platform that provides essential information to cover the gap between the public and the diamond industry.
We present to our clients all over the world the accurate wholesale diamond prices and educate the public purchasing diamonds.
We do believe that an ability to purchase gemstones far lower than retail prices opens the door for everyone to the diamond industry. We work hard to make luxury affordable to everyone.
Serving this purpose, Diamond Registry became the main entrance to the diamond industry for the public interested in buying and selling gemstones. Normally, retail jewelry has many additional costs factored into the final price. Buying in a diamond shop, you pay extra for advertising and marketing, cover the expenses of running a physical store, and support the brand name.
Buying through the Diamond Registry platform, you avoid extra payment easily. You just cover the price listed in a wholesale diamond price chart.
So now, after you’ve learned everything about the principles of determining the diamond cost, it’s time to check out the real price for your specific diamond! Here’s how the process works with us:
Fill our Free Quote form below to narrow the range of diamonds – for example, 3 to 3.5 carat, G to I color, VS1 or VS2, round or cushion shape. If you’re not sure, read The 4Cs guide on our website or simply leave a wide range for us to work with.
After submission, your diamond expert will source our global network of diamond cutters and merchants. There, we see which diamonds are currently available at wholesale prices and collect GIA certificates. for them. We work with GIA certificates only – unless you insist on different grading labs.
Your diamond expert will send the certificates over to you, get in touch with you personally, and walk you through available options. You can pick a diamond from this selection, or ask for more certificates, or change your range. Our diamond experts are dedicated to you personally and work with you to find the perfect diamond and make the overall process as easy as possible.
Once you’re ready, feel free to visit our offices in New York or Hong Kong. Also, you can meet our agents anywhere else in the world to see your loose diamond selection in person.
Once we found the perfect diamond and agree on its price, you have an option to work together with our jewelers on your unique design. So, you get not only the best gem but also the unique design - be that an engagement ring or a set of earrings for an anniversary.
We do believe that an ability to purchase gemstones far lower than retail prices opens the door for everyone to the diamond industry. We work hard to make luxury affordable to everyone.
Serving this purpose, Diamond Registry became the main entrance to the diamond industry for the public interested in buying and selling gemstones. Normally, retail jewelry has many additional costs factored into the final price. Buying in a diamond shop, you pay extra for advertising and marketing, cover the expenses of running a physical store, and support the brand name.
Buying through the Diamond Registry platform, you avoid extra payment easily. You just cover the price listed in a wholesale diamond price chart.